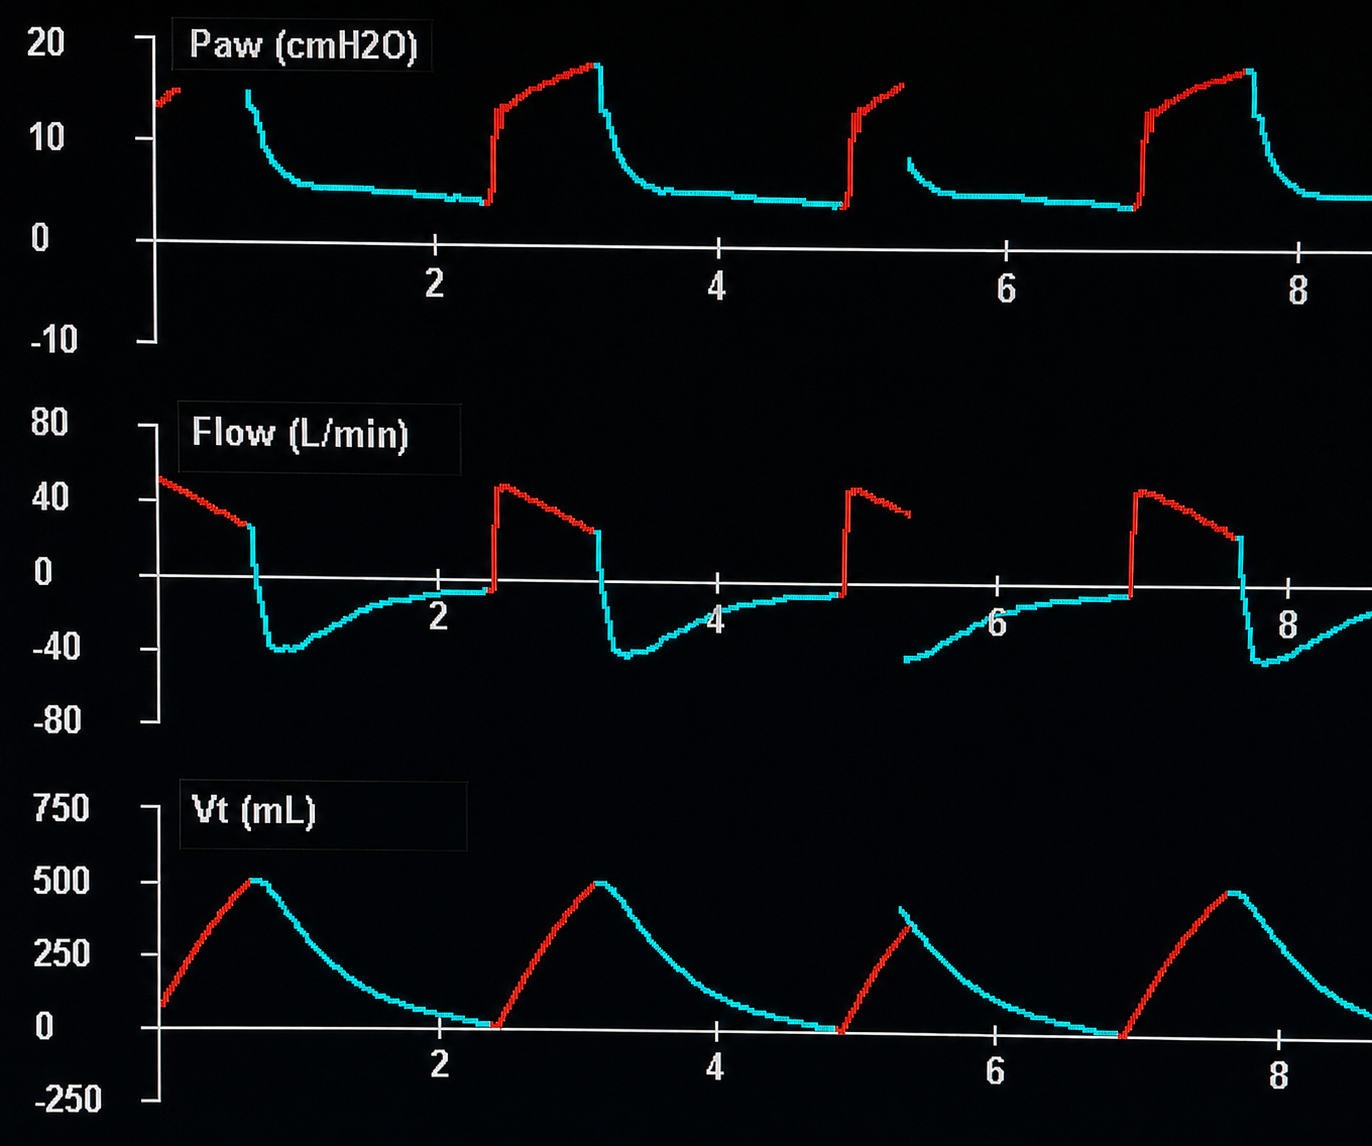
Mechanical ventilator waveform (MVW): a line traced between sequential respiratory measurements collected by the ventilator during each breath.
Core idea: the ventilator continuously records data points over time. Those points are connected into graphical representations of respiratory behavior.
Clinical use: several waveforms are reviewed together because each waveform shows a different view of the same underlying dataset: the breath.
Primary waveform signals: modern ventilators commonly present flow, pressure, and volume as the main waveform views.
Scope: This page is about ventilator waveforms only. Waveforms are not ventilator modes. Modes are a separate discussion. Modes are classified from an evaluation of waveform behavior.
What is a Mechanical Ventilator
What is a Mechanical Ventilator?
A “mechanical ventilator,” or simply a “ventilator,” is an automated device that moves a controlled mixture of air and supplemental oxygen into and out of the lungs.
Key respiratory therapy terms: ventilation, gas exchange, oxygen delivery, lung movement, and respiratory failure.
The device supports patients who have stopped breathing or whose respiratory function has failed.
Trends view: historical ventilator information used to monitor disease severity, recovery, ventilation needs, and oxygenation requirements over time.
Real-Time view: live waveform information used to identify immediate changes such as coughing, breath stacking, and patient-ventilator asynchrony.
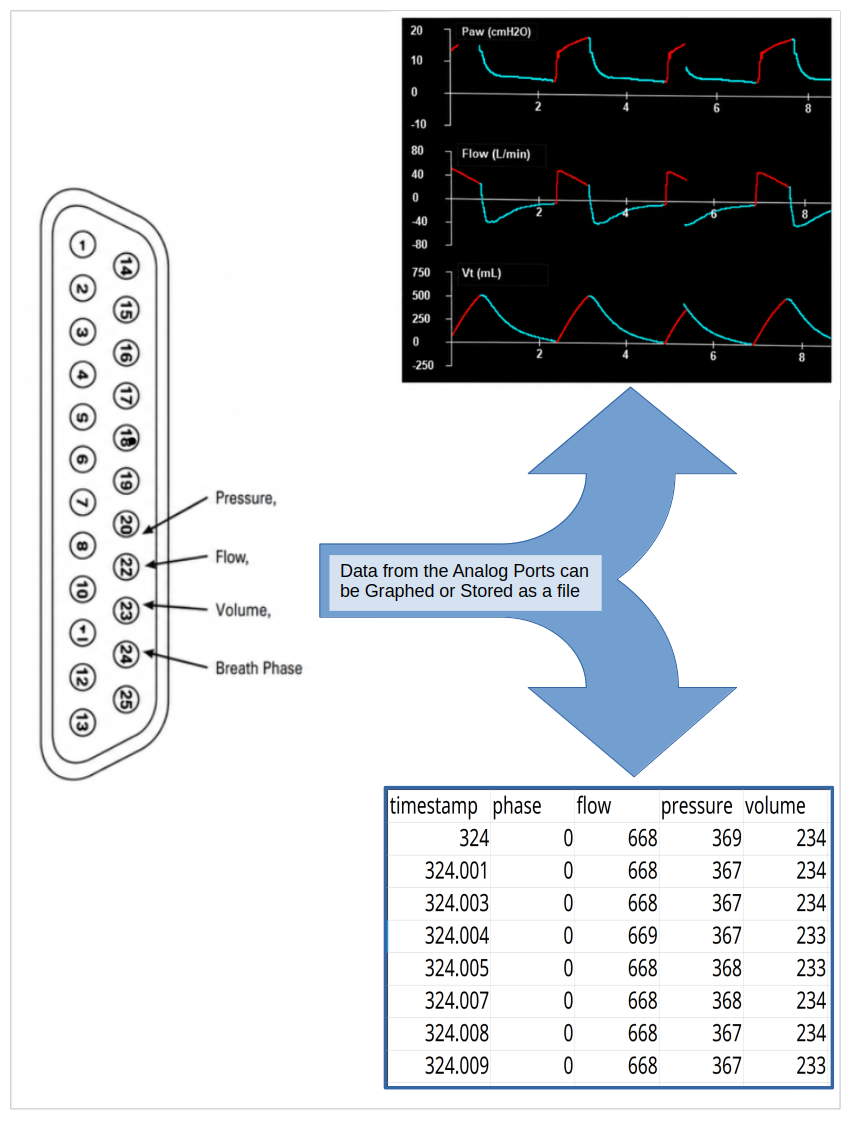
Lesson data: analog output ports were reconstructed into timestamped pressure, flow, volume, and breath-phase traces for playback and download.
Data Creation to Data Collection: Mechanical ventilator data can be collected manually when a clinician or technician reviews the Trends and Real-Time displays at the bedside. The measurements behind those displays can also be collected automatically. In this lesson, waveform measurements came from the AVEA ventilator using the RS-232 interface and analog output signals.
Collection pathway: AVEA analog signals -> RS-232 connector -> Arduino Uno -> timestamped data stream -> workbook -> interactive waveform player on pages 12-19.
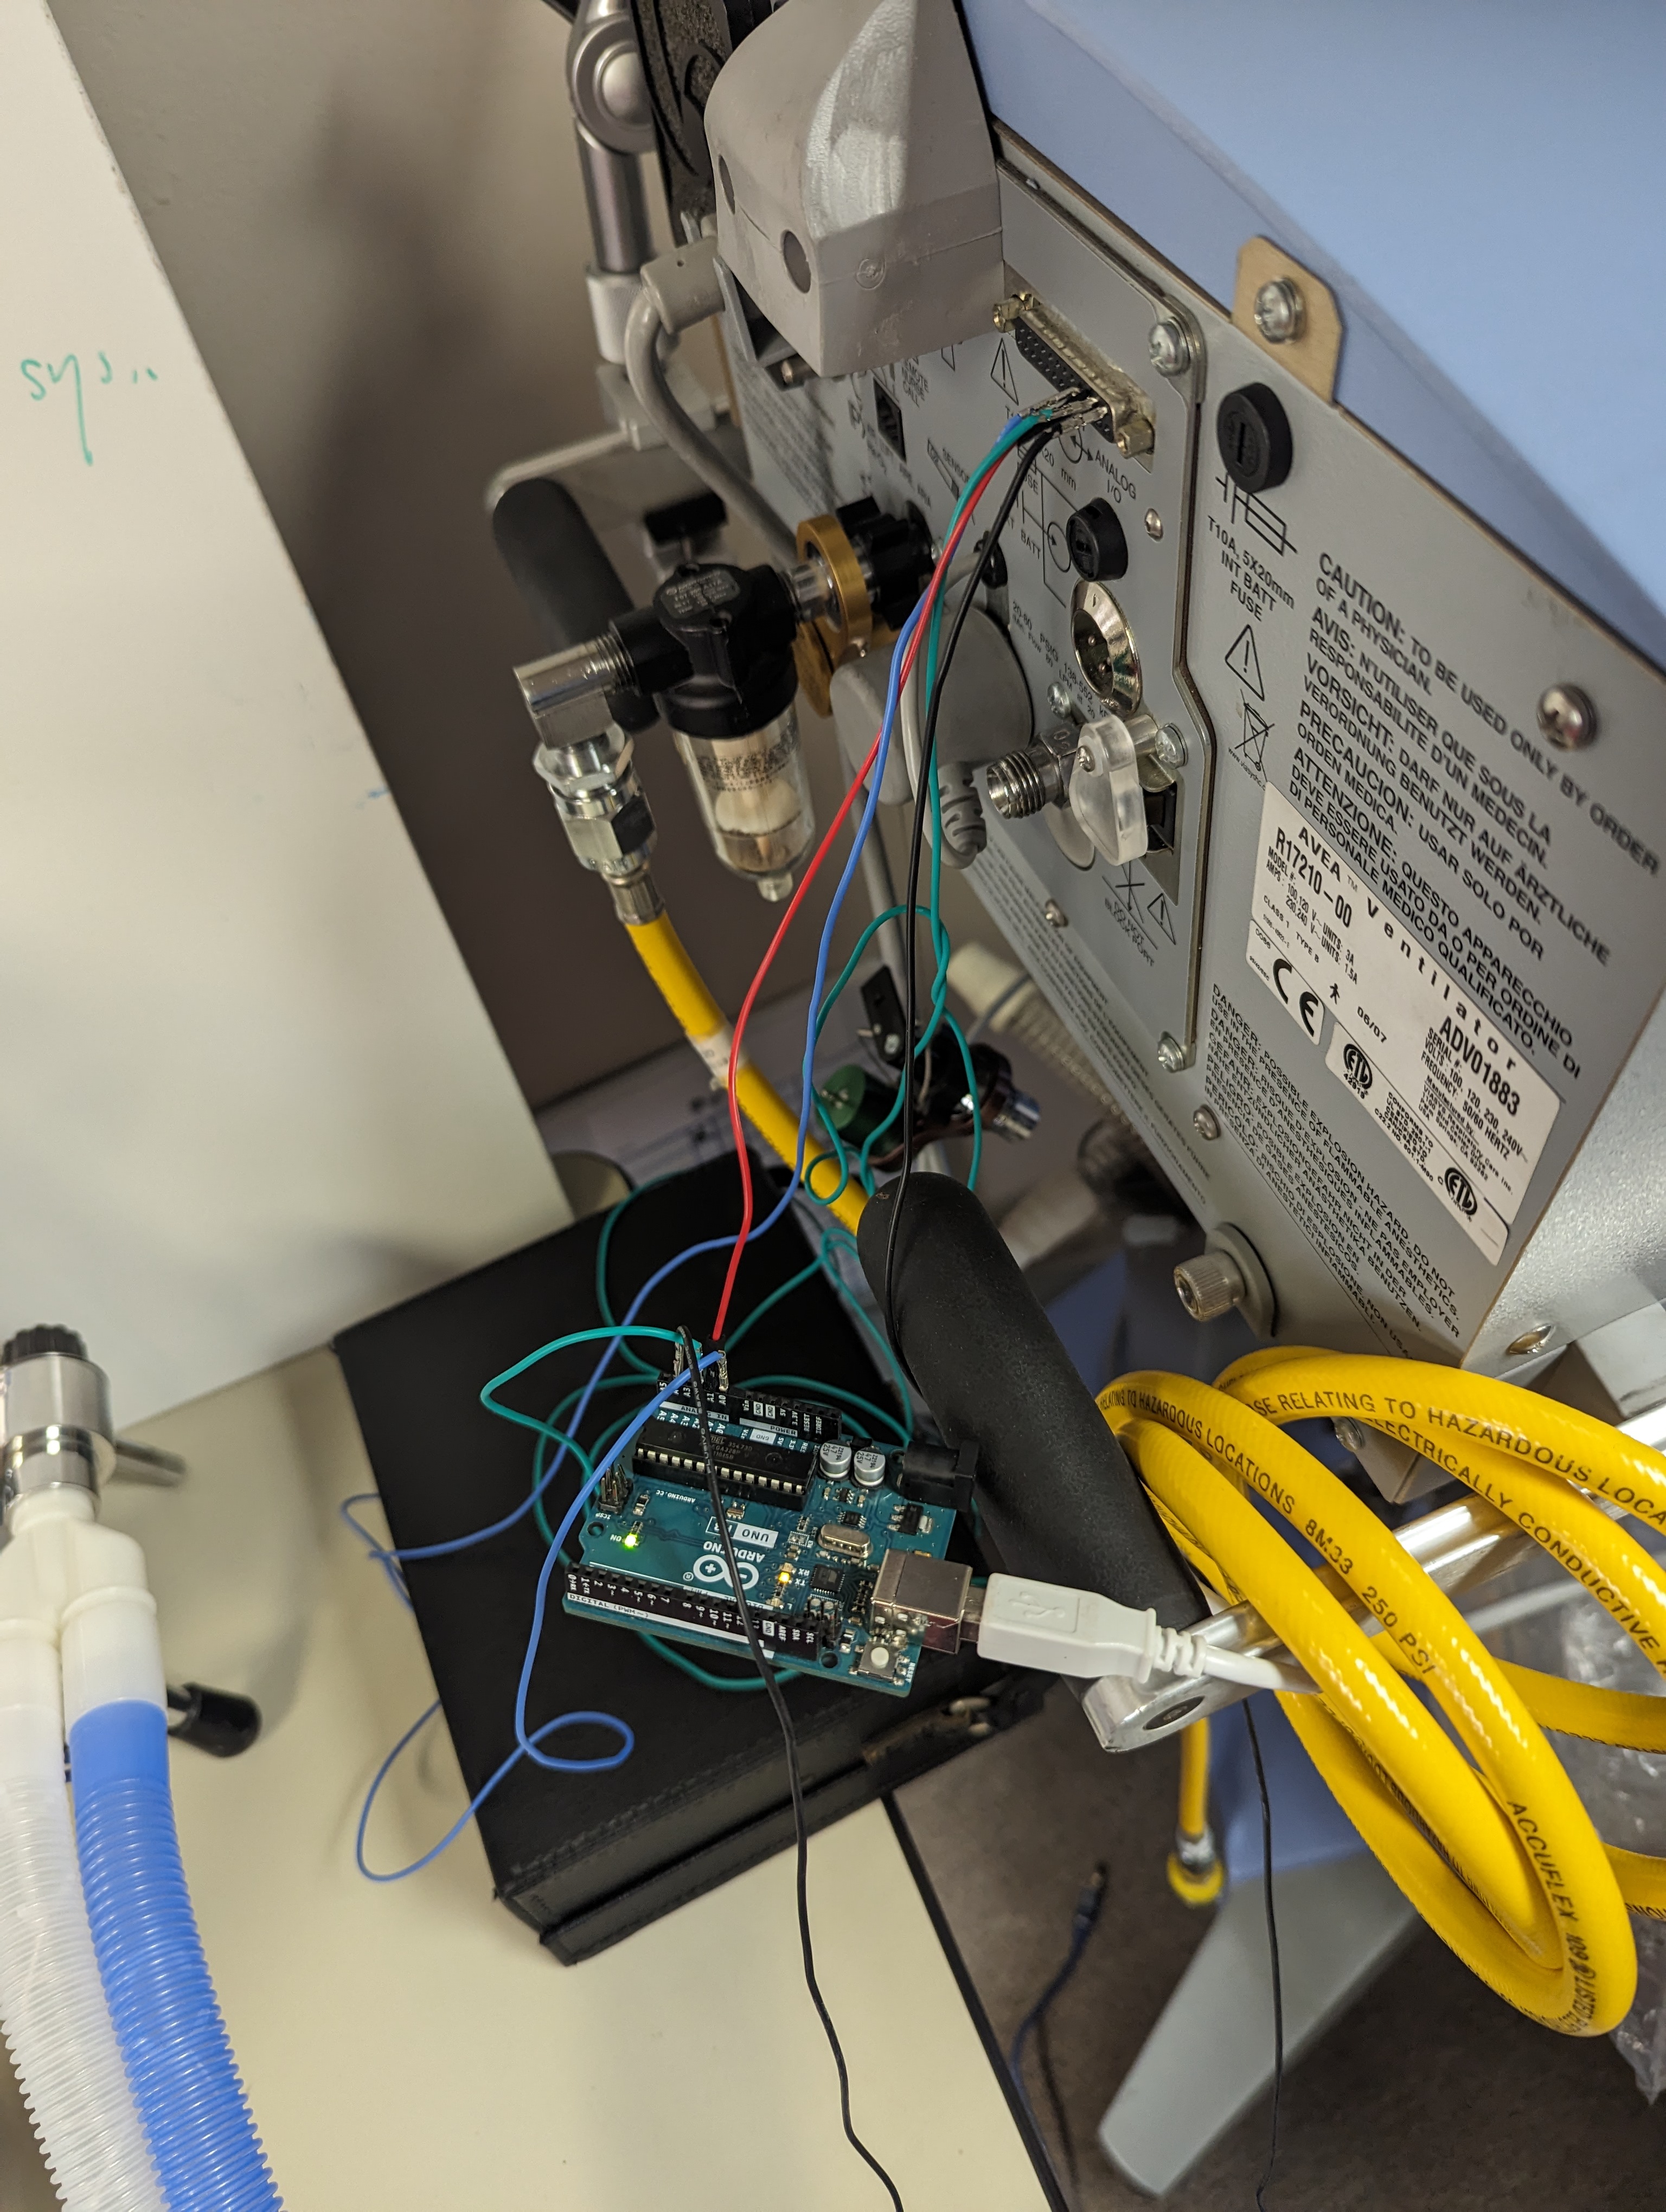
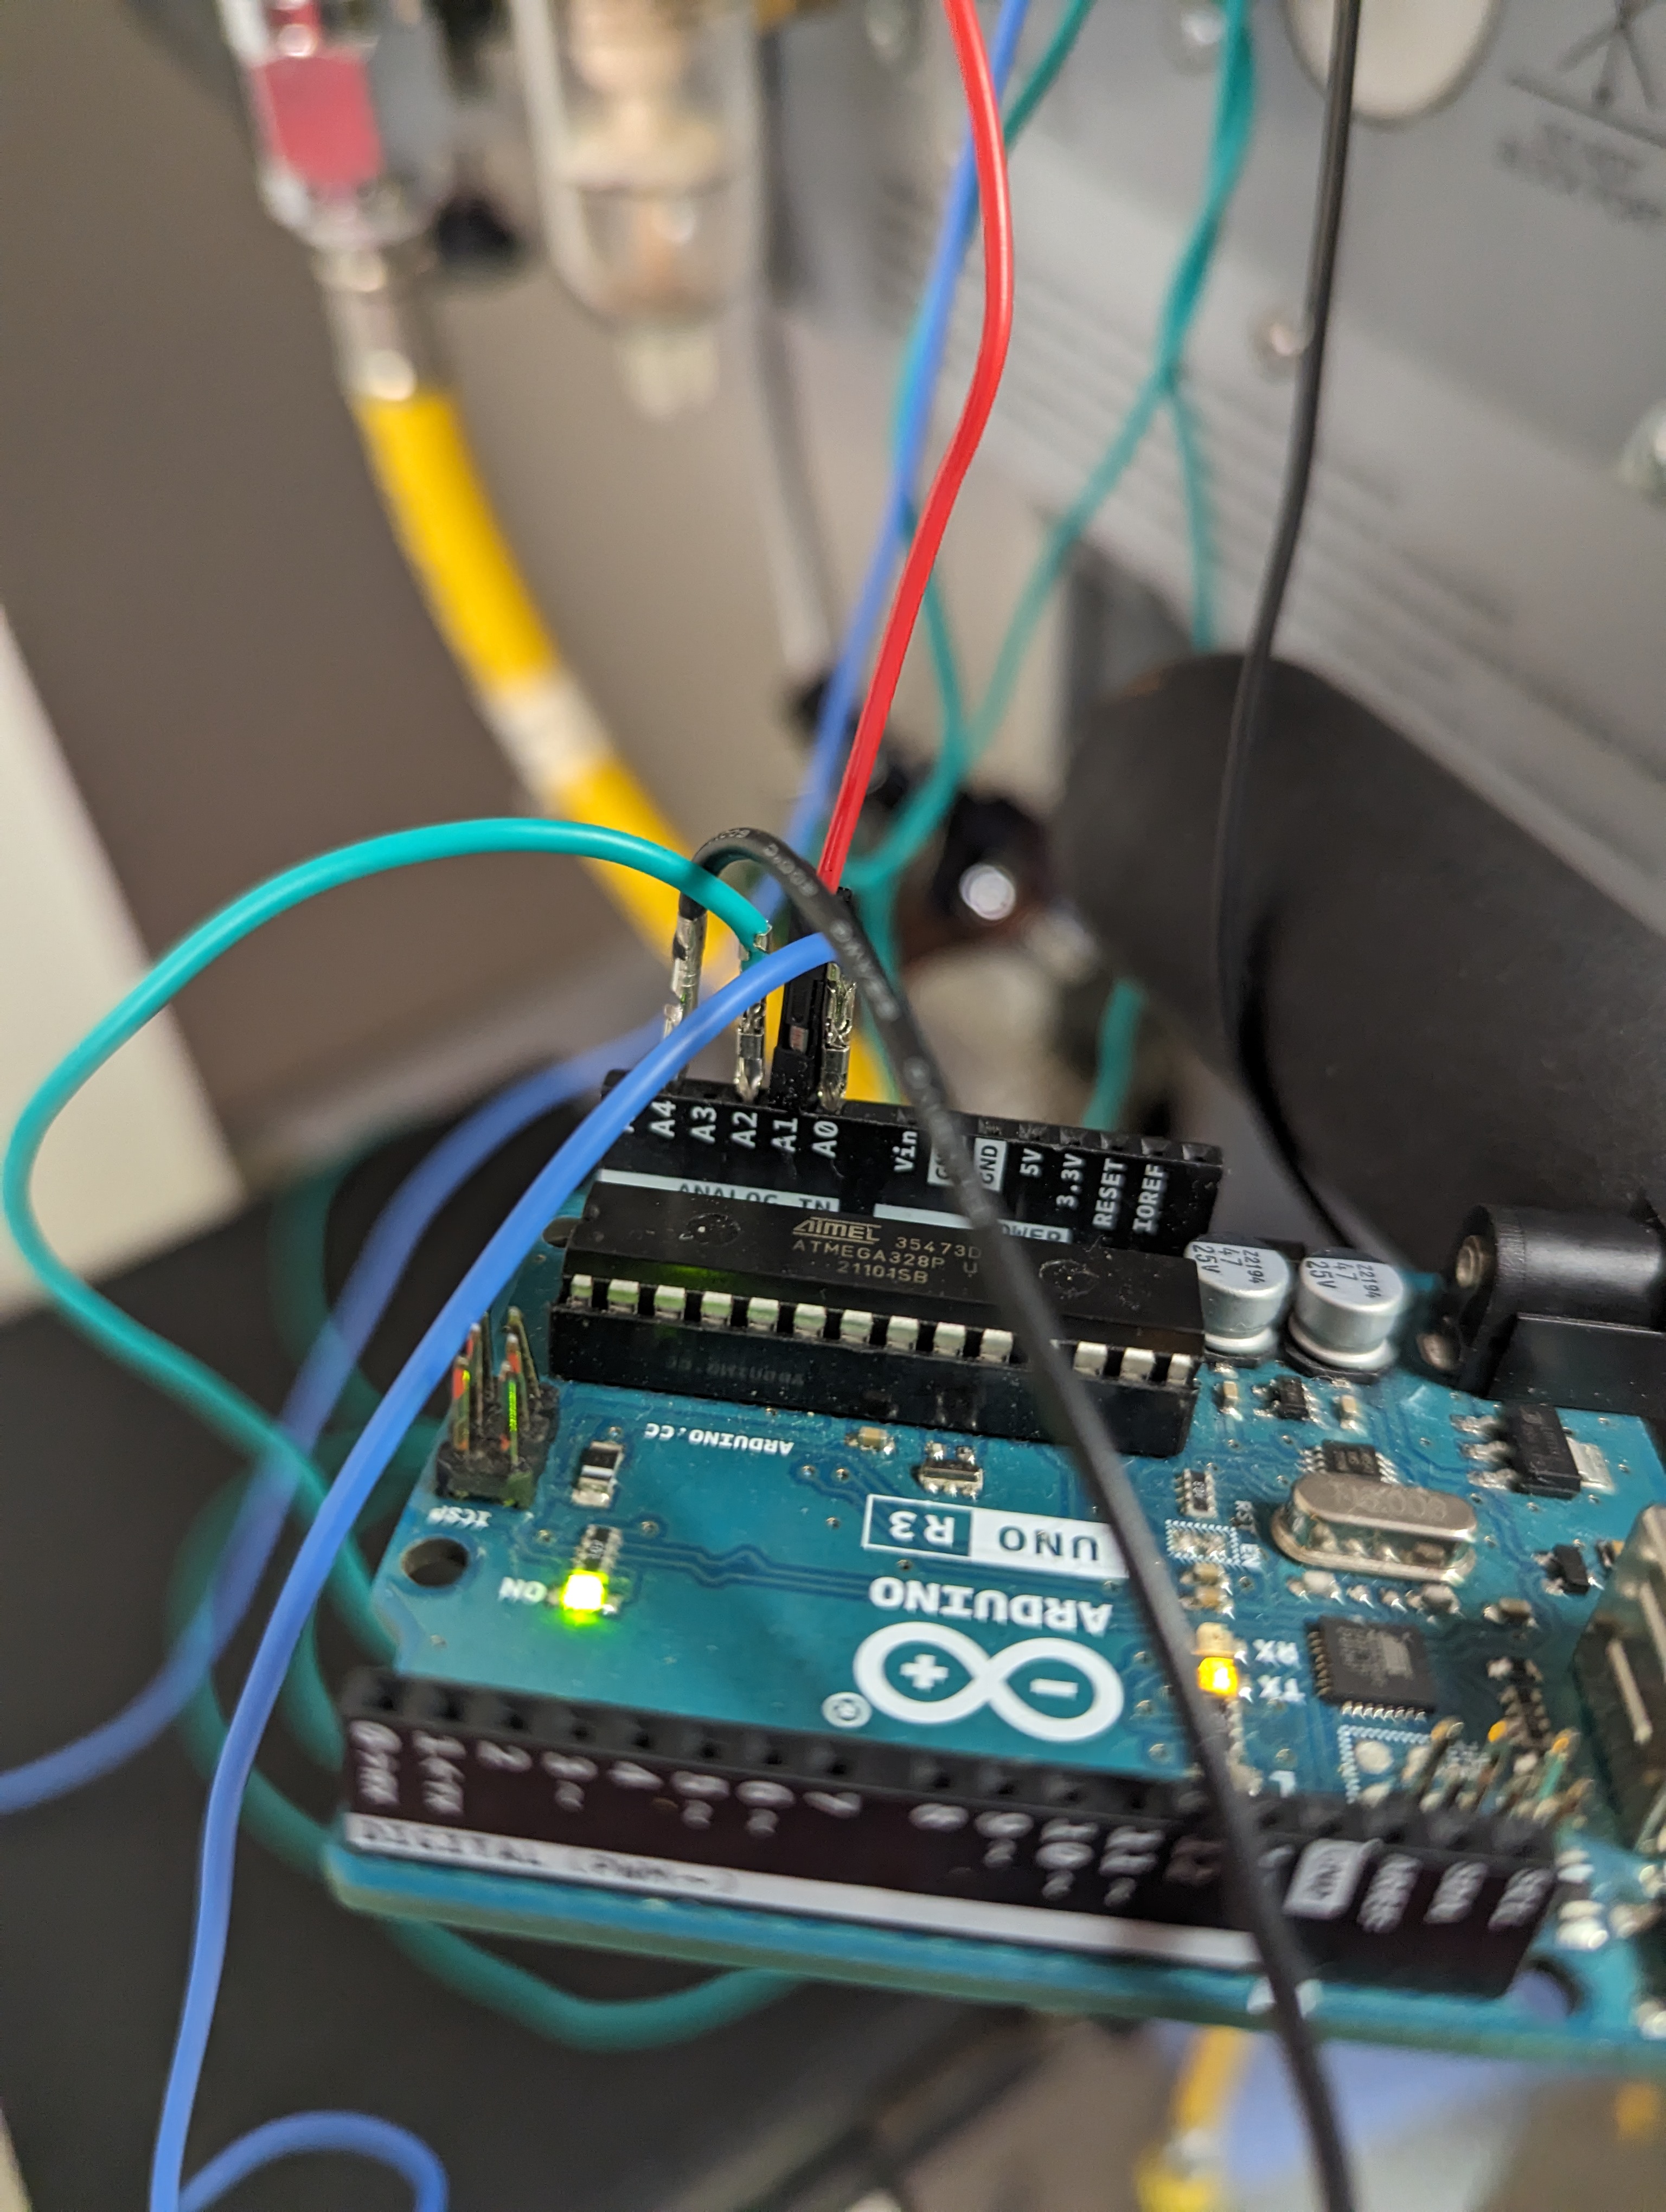
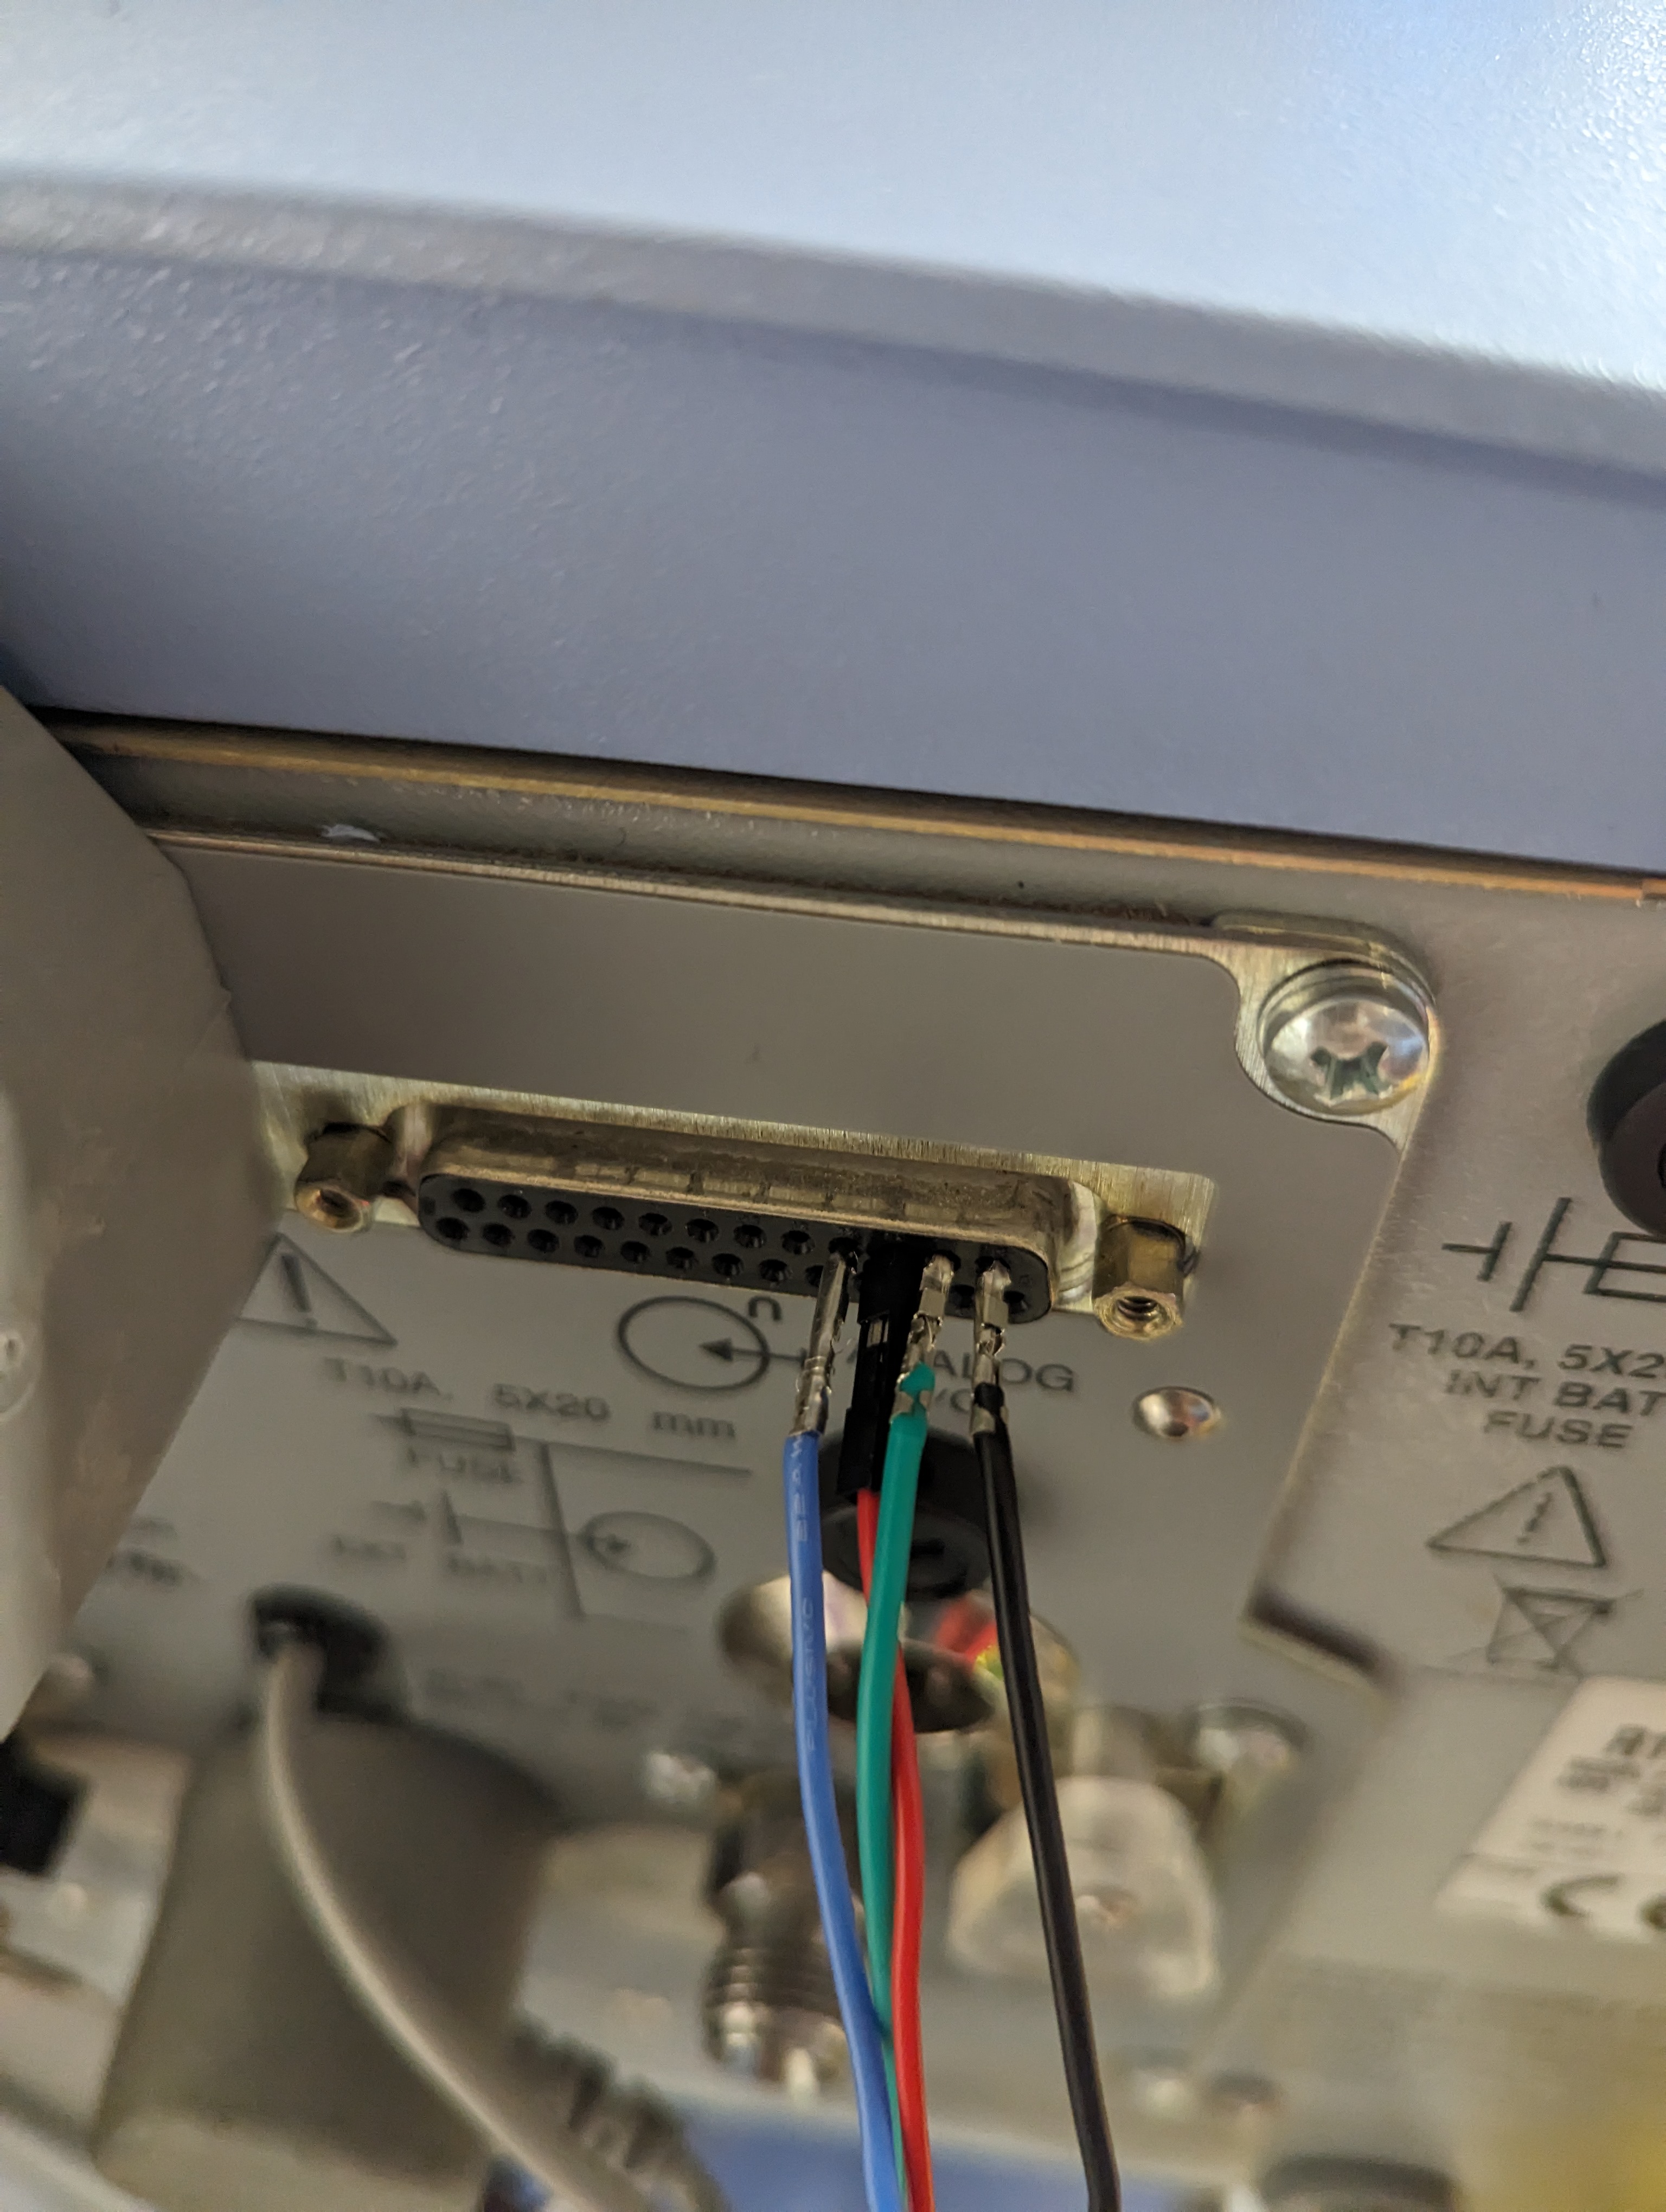
Figure 1: Diagram of how AVEA analog output was captured and converted into plotted waveform evidence.Figure 2: Complete ventilator-to-Arduino connection setup.Figure 3: Arduino Uno setup used for data collection.Figure 4: RS-232 pin configuration for the AVEA ventilator.Figure 5: Clean AVEA waveform examples as they would appear on the ventilator screen.
Trace
The diagram shows the path from AVEA analog output pins to Arduino capture, workbook conversion, and waveform plotting.
Export
The complete setup connected the AVEA ventilator output to the Arduino capture path so the analog output could become a timestamped workbook.
Prepare
A series of DuPont pins were inserted into the Arduino Analog Input Pins to receive RS-232 output signals.
Capture
The DuPont Pins were inserted into RS-232 pin 22, 23, 24, and 25. Data was collected polled as at 1 millisecond intervals.
Plot
The resulting values for every millisecond were exported as timestamped rows in a comma separated value field and plotted against clean AVEA waveform examples.
Use the playback controls to animate the captured sensor stream, then move through each waveform view one at a time.
PlayStopSlowFastRev
What these views show
These charts are commonly used on mechanical ventilators and are unofficially treated as an industry-standard set. Most modern ventilators present these seven views in some form, arranged across different screen layouts. The combined view places airway pressure, flow, volume, and breath phase on the same time axis so the timing relationship between the four exported analog signals can be inspected during playback.
Speed: 1x
View 1 of 7
Combined Sensor Strip
Manual output map
PAW pin 22, flow pin 23, volume pin 24, breath phase pin 25; grounds are pins 9-13 on the DB25 connector.
Analog output family
The dashboard uses the four ventilator analog outputs described by the service manual, then plots the captured workbook samples as time waveforms and loops.
Airway Pressure Vs. Time
Airway pressure signal
Airway pressure, labeled PAW in the reference, is plotted over time to show how pressure changes during each breath.
Connection
DB25 connector, pin 22. Ground pins 9-13.
Range
-60 to 140 cmH2O.
Scale
1 cmH2O / 25 mV.
Accuracy
+/- 50 mV or +/- 5% of reading, whichever is greater.
Zero offset
1.5 VDC at 0 cmH2O.
Flow Vs. Time
Flow signal
Flow is plotted over time to show gas movement into and out of the patient circuit. Shape, timing, and return toward baseline help describe the breath pattern.
Connection
DB25 connector, pin 23. Ground pins 9-13.
Inspiratory/expiratory signal
When selected, the ventilator provides a continuous analog voltage representative of inspiratory flow minus expiratory flow.
Inspiratory/expiratory range
Adult -300 to 200 L/MIN; pediatric -120 to 80 L/MIN; neonate -60 to 40 L/MIN.
+/- 10% of reading or +/- 30 mV, whichever is greater.
Machine delivered flow zero offset
None.
Volume Vs. Time
Volume signal
Volume is plotted over time to show delivered or returned volume through the breath cycle. It gives a separate view of breath size and timing.
Connection
DB25 connector, pin 24. Ground pins 9-13.
Range
Adult -1.00 to 4.00 L; pediatric -200 to 800 mL; neonate -100 to 400 mL.
Scale factor
Adult 1 L / V; pediatric 1 mL / 5 mV; neonate 1 mL / 10 mV.
Accuracy
+/- 10% of reading or +/- 30 mV, whichever is greater.
Zero offset
1.000 VDC.
Breath Phase Vs. Time
Breath phase signal
Breath phase is a signal identifying where the ventilator is in the breath cycle. The reference describes inspiration as 5 VDC and expiration as 0 VDC.
Connection
DB25 connector, pin 25. Ground pins 9-13.
Voltage meaning
The ventilator provides a continuous analog voltage representative of breath phase. Inspiration = 5 VDC; expiration = 0 VDC.
How to read it
Phase is normalized in this dataset; 0 is Exhalation, 1 is Inhalation and 2 is Sensor Error for that row of data.
PV Loop (Pressure vs Volume)
Pressure-volume loop
A loop view plots pressure against volume instead of time. This shows how the two sensor signals relate during the breath cycle.
Pressure source
PAW from DB25 connector pin 22, range -60 to 140 cmH2O, scale factor 1 cmH2O / 25 mV, zero offset 1.5 VDC at 0 cmH2O.
Volume source
Volume from DB25 connector pin 24, adult range -1.00 to 4.00 L, pediatric range -200 to 800 mL, neonate range -100 to 400 mL.
Loop meaning
The loop combines those two manual-defined analog outputs so pressure and volume can be reviewed together across the breath.
FV Loop (Flow vs Volume)
Flow-volume loop
This loop plots flow against volume to show how movement of gas relates to changing volume through the breath cycle.
Flow source
Flow from DB25 connector pin 23. Inspiratory/expiratory flow range is adult -300 to 200 L/MIN, pediatric -120 to 80 L/MIN, neonate -60 to 40 L/MIN.
Volume source
Volume from DB25 connector pin 24. Adult range is -1.00 to 4.00 L; pediatric and neonate ranges are reported in mL.
Loop meaning
The loop pairs the service-manual flow and volume outputs so gas movement can be compared with changing volume during the breath.
Current Data Stream
Identify Waveform Evidence
Use filtered workbook charts and the numbered DB25 connector figure to identify waveforms, breath limbs, and AVEA analog output pins.
Signal IDQuestion 1
Which pin carries this signal?
Page reviewed and edited by Paul Michael Casillas, MSRC. Last reviewed: July 6, 2026. Last edited: July 16, 2026.